Taking wireshark logs with the CAS Gateway
Capturing network traffic using Wireshark is a common troubleshooting technique when diagnosing communication or protocol issues involving a CAS Gateway. By enabling detailed debug logging on the gateway and collecting both BACnet and Syslog traffic, engineers can correlate application-level events with network-level behavior.
This article describes a repeatable process for configuring a CAS Gateway to emit detailed log messages and for capturing those messages using Wireshark on a separate computer. The resulting packet capture files can then be reviewed locally or shared with Chipkin support for further analysis.
The steps below assume that the CAS Gateway is already operational on the network and that the user has administrative access to both the gateway and the capture workstation.
Configuring Debug Logging on the CAS Gateway
The first step is to configure the CAS Gateway to generate detailed debug output and forward it using Syslog. This ensures that internal gateway events are visible alongside captured network traffic.
- Log in to the CAS Gateway web interface.
- Navigate to the System Actions page at /bin/system/.
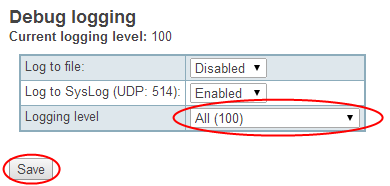
- Under the debug logging section, change the logging level from IMPORTANT (10) to ALL (100).
- Verify that Log to SysLog (UDP: 514) is enabled. This is the default setting.
- Click the Save button to apply the changes.
- Click Generate Configuration File to download the current gateway configuration.
The configuration file should be saved, as it may be required later when reviewing the captured logs or when submitting data for support.
Installing and Configuring Wireshark
Wireshark is a free and widely used packet capture tool that can record and analyze network traffic in real time. It is used here to capture both BACnet/IP packets and Syslog messages emitted by the CAS Gateway.
- Download and install Wireshark from https://www.wireshark.org/ on a local computer.
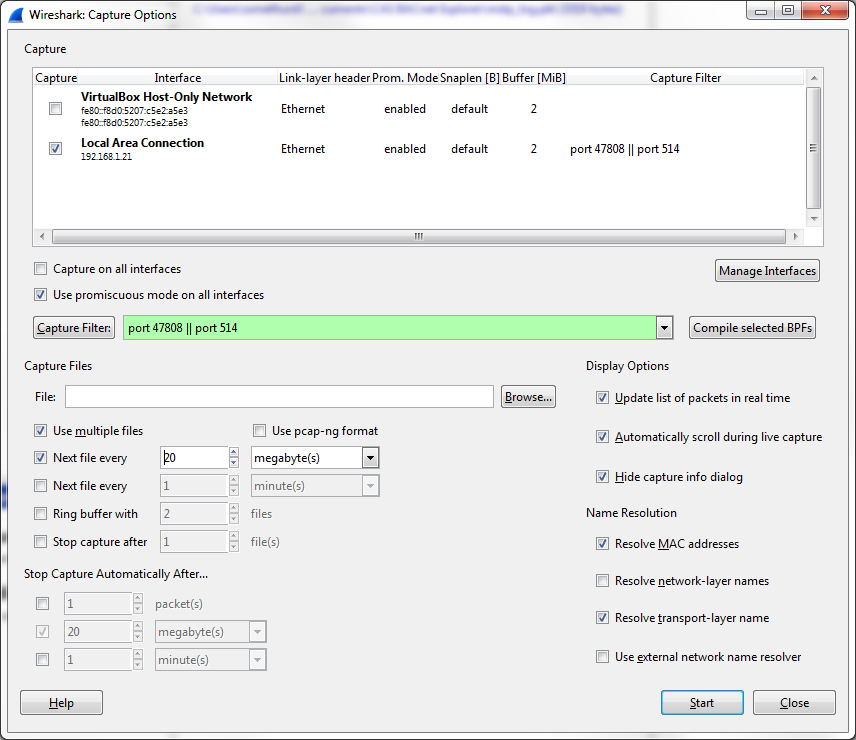
- Launch Wireshark and click the Capture Options button.
-
Set the Capture Filter to:
port 47808 || port 514 -
Specify a folder path where capture files will be stored, for example:
C:\temp\wireshark_logs\ - Enable Use multiple files and Next file every, then set the size to 20 megabytes.
These settings ensure that BACnet/IP traffic (default UDP port 47808) and Syslog traffic (UDP port 514) are captured while preventing individual capture files from becoming excessively large.
Capturing and Reviewing Traffic
Once capture options are configured, begin the packet capture and allow it to run while the issue is reproduced.
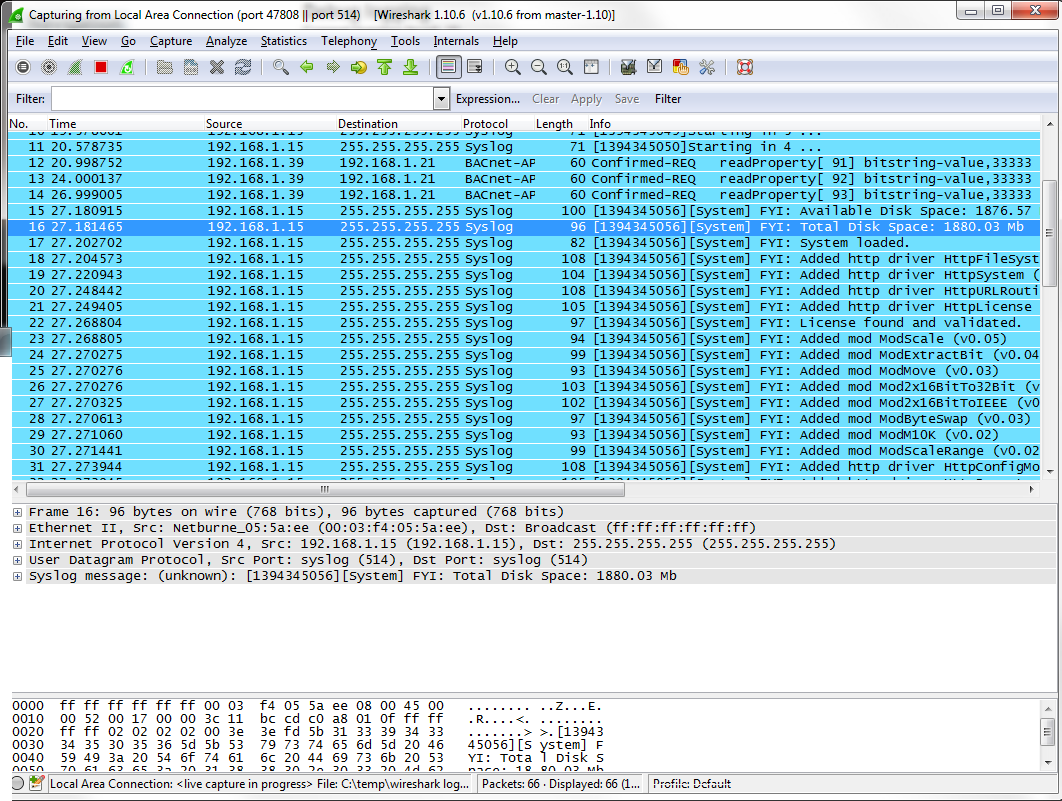
- Click the Start button in the Wireshark Capture Options dialog.
- Verify that the main Wireshark window begins to populate with BACnet and Syslog packets.
- Reproduce the issue involving the CAS Gateway. This may require extended capture time if the problem occurs infrequently.
- Stop the capture once sufficient data has been collected.
The resulting capture files should include both protocol traffic and gateway-generated Syslog messages, allowing events to be correlated by time.
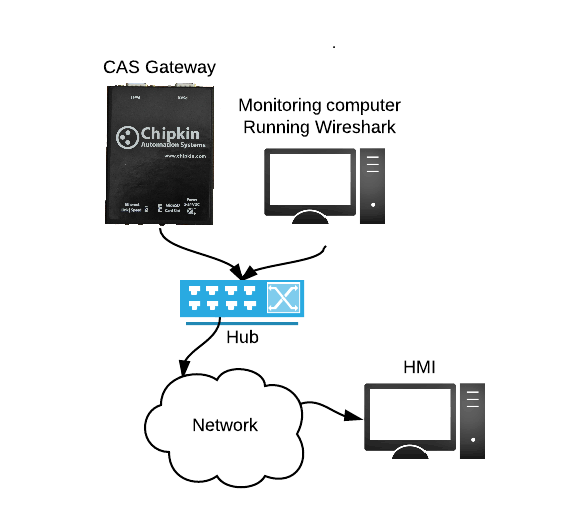
Network Topology Considerations
Depending on the network layout, capturing all relevant traffic may require additional hardware. In some cases, an Ethernet hub (not a switch or router) may be required to observe all packets sent to and from the CAS Gateway.
More information on this topic is available here: Hubs vs. Switches when using Wireshark .
After completing the capture, provide Chipkin support with an archive of the Wireshark capture files along with the CAS Gateway configuration file for further analysis.