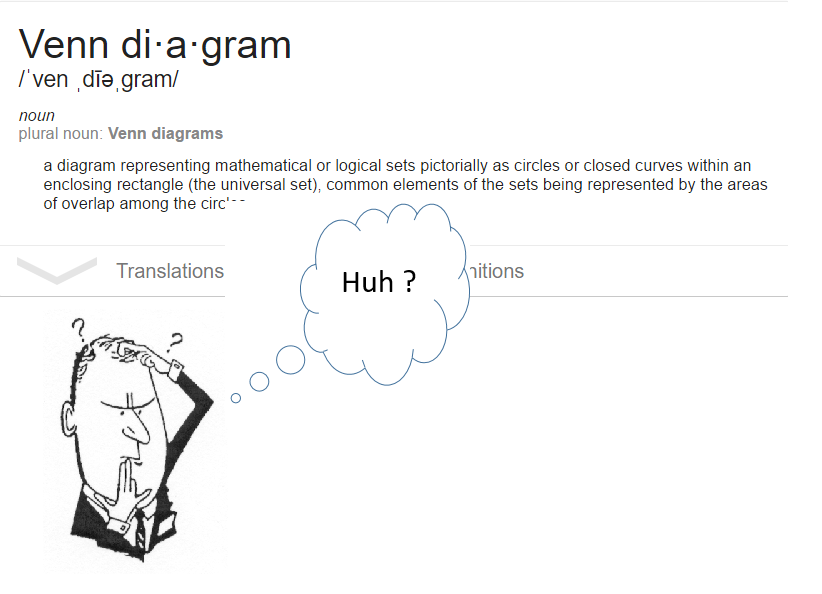
Venn Diagram in simple comic terms
Our take on Venn Diagrams
Venn diagrams are a simple way to show how two (or more) groups relate to each other—what’s unique to each group, and what they share in common. In “comic terms,” think of each circle as a club. Where the circles overlap is the group of people who belong to both clubs at the same time.
In building automation and networking, Venn diagrams are handy for explaining overlaps like: protocols vs. physical layers, products vs. use-cases, or “what this device supports” vs. “what the system needs.”
Brief description
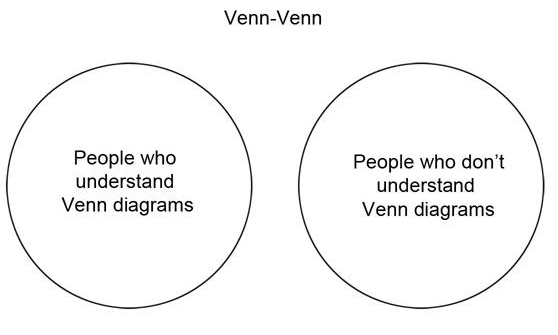
A Venn diagram is a graphical representation used to illustrate relationships between different sets or groups. It is typically drawn with overlapping circles (or other shapes), where each circle represents a set and the overlap represents elements shared by multiple sets.
- Left circle: items that belong only to Set A
- Right circle: items that belong only to Set B
- Overlap: items that belong to both Set A and Set B
- Outside the circles: items that don’t belong to either set (in the context you defined)
Venn diagrams are commonly used in mathematics, logic, statistics, engineering, and technical documentation to quickly communicate similarities, differences, and intersections between concepts.
FAQ: Venn Diagrams (Simple Terms)
What does the overlap in a Venn diagram mean?
The overlap shows what the two groups have in common—items that belong to both sets at the same time.
What do the non-overlapping parts of the circles mean?
Each non-overlapping area shows what is unique to that set—items that belong to one group but not the other.
Can a Venn diagram represent more than two sets?
Yes. You can add more circles to represent more sets, though diagrams become harder to read as the number of sets increases.
Why use Venn diagrams in technical documentation?
They provide a fast visual way to explain relationships like “compatible vs. not compatible,” “supported vs. unsupported,” or “protocol features that overlap.”
What is a common mistake when reading a Venn diagram?
Assuming the overlap means “everything works together” without defining what the sets represent. The meaning depends entirely on how you label the sets.