SNMP - How can I test SNMP
Integration Solutions
Chipkin has integration solutions for almost every situation. We specialize in network protocol communications and have over 20+ years of experience. Click for more information:
This article provides a step-by-step procedure to test an SNMP setup by (1) polling OIDs using a free SNMP manager tool and (2) verifying SNMP traps using Wireshark. A sample configuration is included at the end of the page.
The workflow shown here uses PowerSNMP Free Manager for polling and Wireshark for validating trap traffic. The screenshots below follow the same sequence you would use in a typical FieldServer/gateway SNMP test.
Quick Notes Before You Start
- Configuration is provided at the end of this page.
- SNMP driver version shown: 1.03mK.
- This procedure uses PowerSNMP Free Manager (free download).
Part 1 — Test SNMP Polling (PowerSNMP Free Manager)
Download PowerSNMP Free Manager here: PowerSNMP Free Manager (dart.com)
When you start the application, you will see the initial configuration screen.
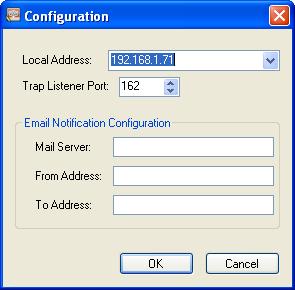
In the example screenshots, 192.168.1.71 is the IP address of the laptop running PowerSNMP.
Click OK or Cancel on the initial screen (either is fine).
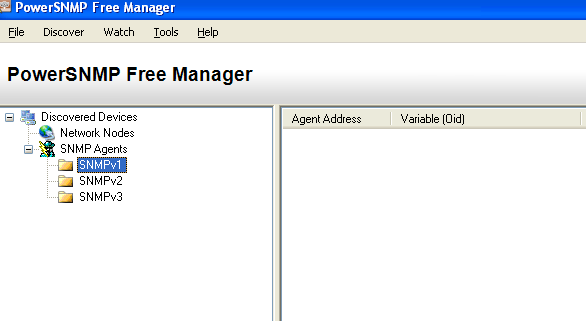
Click Discover.
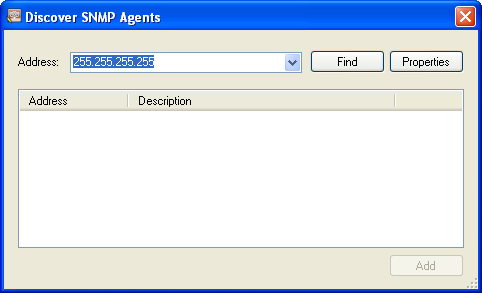
Specify the IP address of the FieldServer/gateway.
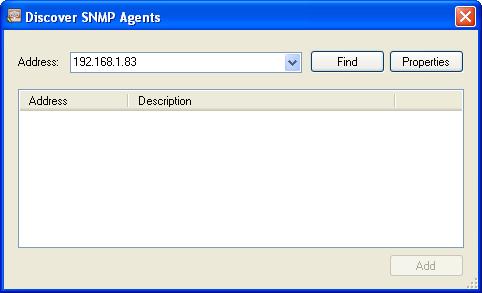
Click Find. When found, the result will look similar to the screenshot below.
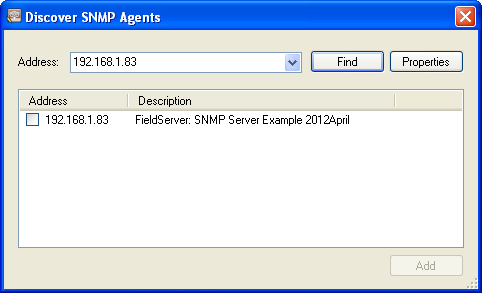
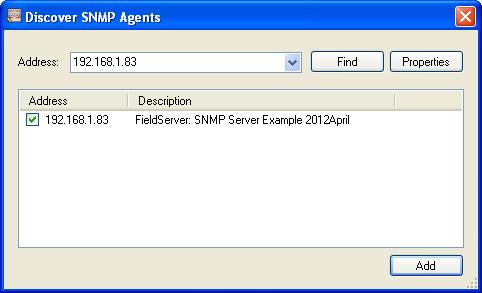
Check the box and click Add.
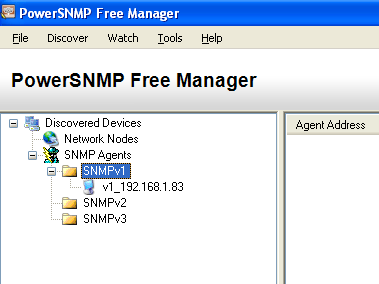
Right click the device and select Add Watch.
You will see a variable screen. The default variable (OID) is not correct.
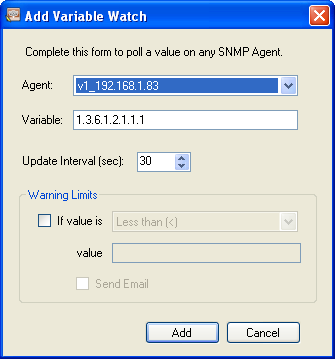
The variable/OID below corresponds to the 1st item in DA_SNMP_1.
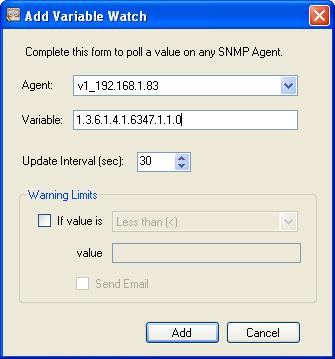
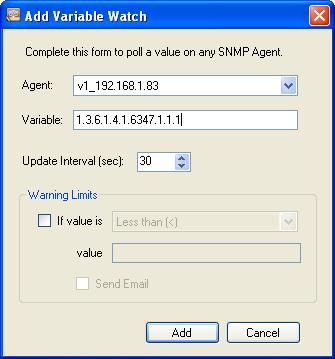
The variable/OID below corresponds to the 2nd item in DA_SNMP_1.

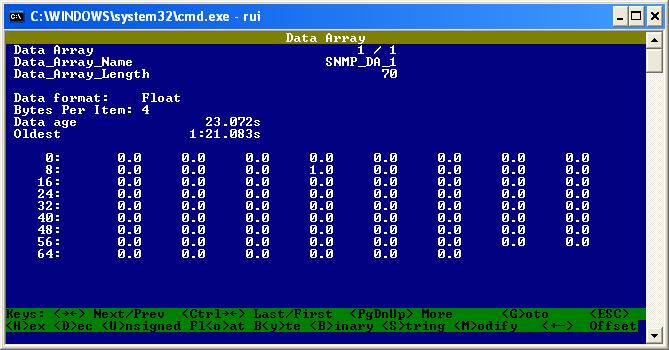
Here you can see the values.
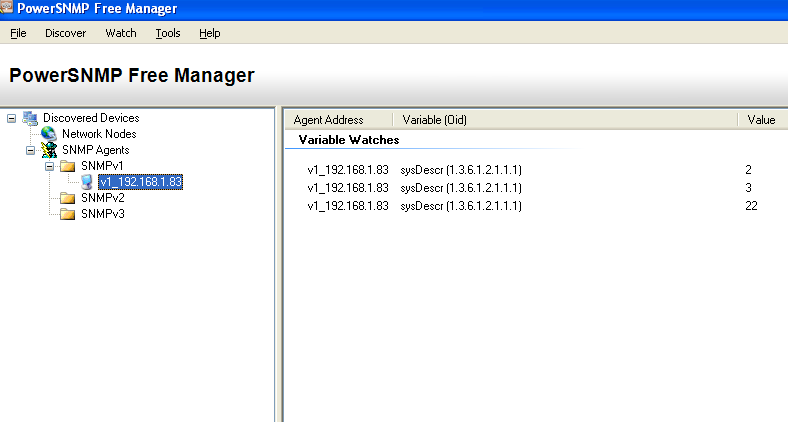
Test for polling is complete.
Part 2 — Test SNMP Traps (Wireshark)
The trap test in this article uses the laptop IP as the trap destination. Ensure the IP used is the IP of your laptop. The example below shows the laptop IP as 192.168.1.71.
Remote_Client_Node_Descriptors
Node_Name , Node_ID , Protocol , Adapter , IP_Address
Mngr1 , 11 , SNMP , N1 , 192.168.1.71
Start Wireshark.
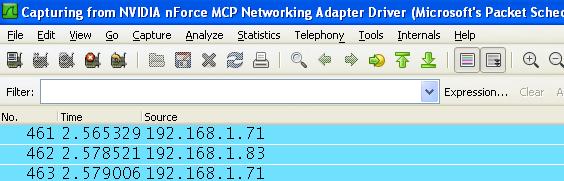
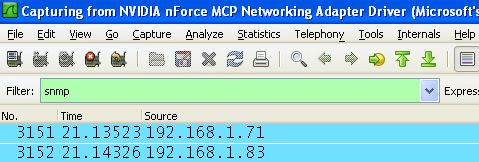
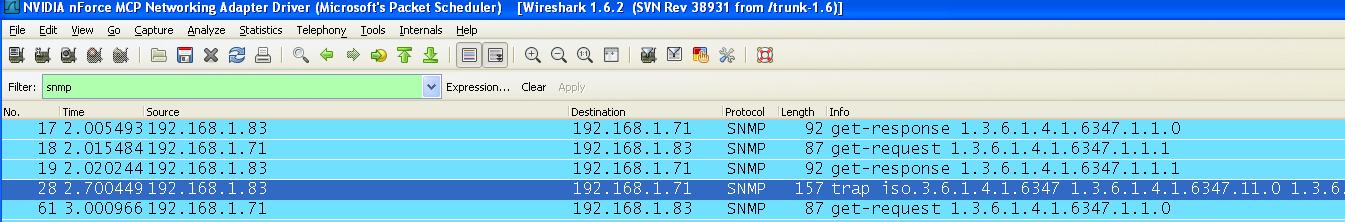
Set the filter to SNMP.
Generate a trap by poking data into offset 11 (example: poke value 1 into offset 11).
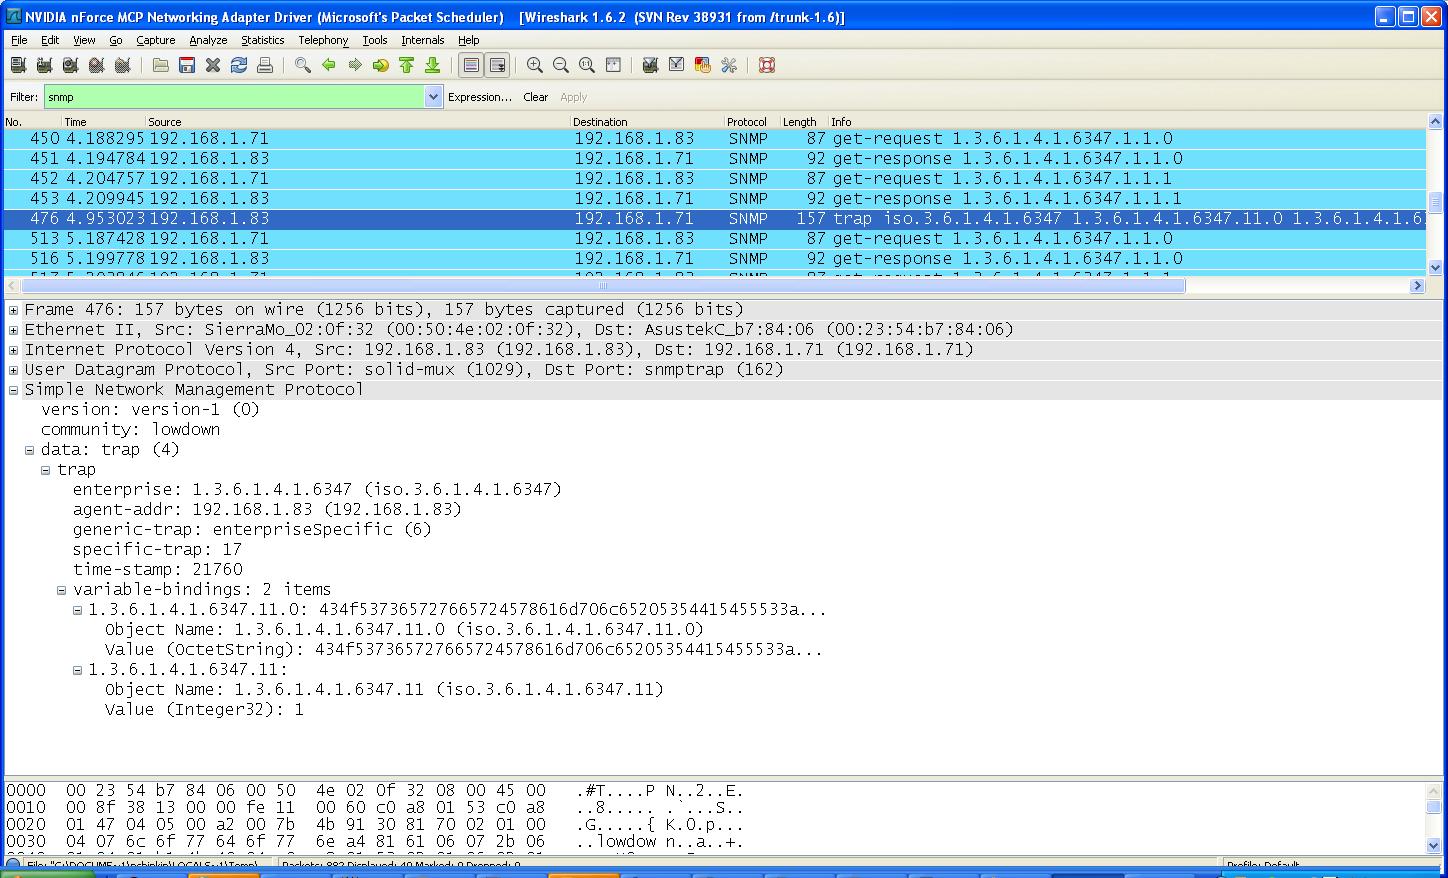
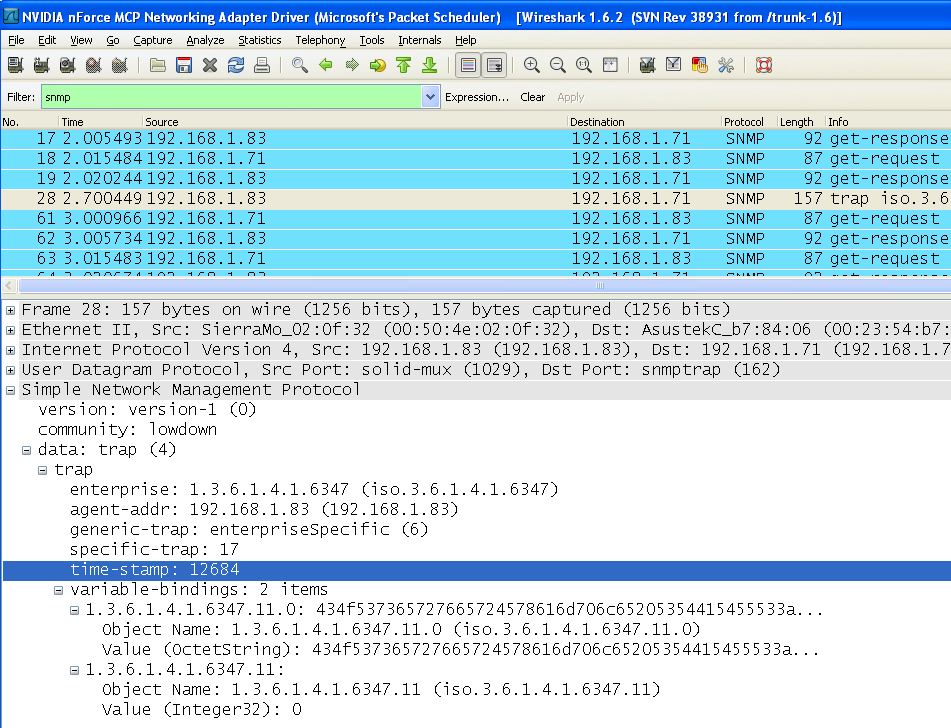
You should see a trap in Wireshark. Expand the trap packet to view details.
Set the value of offset 11 back to 0 and look for a new trap.
Additional example values shown in the original procedure: set offset 12 to 100, then 101, then 80, then 15. The article indicates there should be 3 traps.
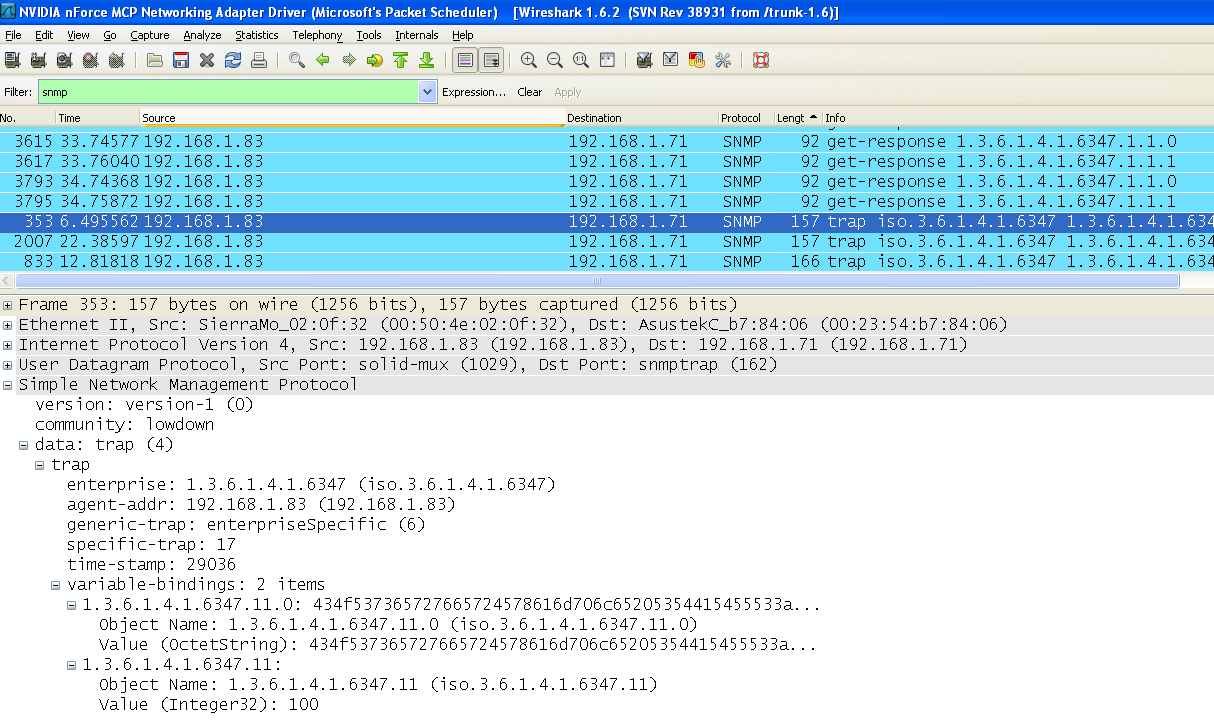
Trap test is complete.
Configuration (as provided in the original article)
//================================================================================
//
//    Common Information
//
Bridge
Title
SNMP Server Example 2012April
//================================================================================
//
//    Data Arrays
//
Data_Arrays
Data_Array_Name , Data_Format , Data_Array_Length
SNMP_DA_1       , FLOAT       , 70
//================================================================================
//
//    Server Side Connections
//
Connections
Adapter , Protocol , SNMP_Community
N1      , SNMP     , lowdown
//================================================================================
//
//    Remote Client Nodes
//
Nodes
Node_Name , Protocol
Agent_1   , SNMP
Remote_Client_Node_Descriptors
Node_Name , Node_ID , Protocol , Adapter , IP_Address
Mngr1     , 11      , SNMP     , N1      , 192.168.1.71
//================================================================================
//
//    Trap Specification
The mapping tables shown below are included exactly as structured in the source, but formatted as HTML tables for readability.
| Map_Descriptor_Name | Data_Array_Name | Data_Array_Offset | Function | Node_Name | SNMP_OID | Length | COS_Normal |
|---|---|---|---|---|---|---|---|
| Air Conditioner 1 Status | SNMP_DA_1 | 00 | SNMP_TRAP | Mngr1 | 1.3.6.1.4.1.6347.000 | 1 | 0 |
| Air Conditioner 2 Status | SNMP_DA_1 | 01 | SNMP_TRAP | Mngr1 | 1.3.6.1.4.1.6347.001 | 1 | 0 |
| High Temperature Alarm Status | SNMP_DA_1 | 02 | SNMP_TRAP | Mngr1 | 1.3.6.1.4.1.6347.002 | 1 | 0 |
| Low Temperature Alarm Status | SNMP_DA_1 | 03 | SNMP_TRAP | Mngr1 | 1.3.6.1.4.1.6347.003 | 1 | 0 |
| Smoke Alarm | SNMP_DA_1 | 04 | SNMP_TRAP | Mngr1 | 1.3.6.1.4.1.6347.004 | 1 | 0 |
| Intrusion 1 or 2 Alarm | SNMP_DA_1 | 05 | SNMP_TRAP | Mngr1 | 1.3.6.1.4.1.6347.005 | 1 | 0 |
| AC Failure | SNMP_DA_1 | 06 | SNMP_TRAP | Mngr1 | 1.3.6.1.4.1.6347.006 | 1 | 0 |
| On UPS Power | SNMP_DA_1 | 07 | SNMP_TRAP | Mngr1 | 1.3.6.1.4.1.6347.007 | 1 | 0 |
| UPS Fail | SNMP_DA_1 | 08 | SNMP_TRAP | Mngr1 | 1.3.6.1.4.1.6347.008 | 1 | 0 |
| HVAC 1 Fail | SNMP_DA_1 | 09 | SNMP_TRAP | Mngr1 | 1.3.6.1.4.1.6347.009 | 1 | 0 |
| HVAC 2 Fail | SNMP_DA_1 | 10 | SNMP_TRAP | Mngr1 | 1.3.6.1.4.1.6347.010 | 1 | 0 |
| Map_Descriptor_Name | Data_Array_Name | Data_Array_Offset | Function | Node_Name | SNMP_OID | Length | COS_Normal | COS_Deadband |
|---|---|---|---|---|---|---|---|---|
| COSserverExample | SNMP_DA_1 | 11 | SNMP_TRAP | Mngr1 | 1.3.6.1.4.1.6347.011 | 1 | COS_Server_Event | 0.9 |
Note: the original article included an intermediate table containing empty cells and comma-prefixed labels. Those empty cells are the source of the “empty strong/bold tags” and formatting errors. The core data rows are preserved above without introducing empty tags.
FAQ
What tools are used in this test procedure?
The article uses PowerSNMP Free Manager for polling and Wireshark to validate SNMP traps.
What IP address should I use for the trap destination?
Use the IP address of the laptop running Wireshark. In the example screenshots, the laptop IP is 192.168.1.71.
How do I confirm polling is working?
After you add the device and create a Watch in PowerSNMP, set the OID to match the items shown for DA_SNMP_1
(as illustrated in the Variable screenshots) and verify that values are displayed in the UI.
How do I confirm traps are working?
Start Wireshark, filter for SNMP, and then generate a trap as shown in the article (example: change offset 11
to 1, then back to 0). You should see trap packets appear in Wireshark.